How do Americans get to places besides their workplace?
The US Census’ American Community Survey (ACS) asks a sampling of Americans every year how they get to work. We have all seen this data – and many of us TDM professionals can recite the approximate national averages of work commute trips made in a single occupant vehicle versus on transit, in a carpool, walking, or biking.
I needed data on trips made for all purposes while doing research to populate a Passenger Transportation Carbon Emission Reduction Strategy Tool my employer, SLR Consulting, created, and came across data from the National Household Transportation Survey (NHTS). The NHTS has been tracking mode of transportation, duration, distance, and trip purpose since 1969. Historically conducted every 5-8 years, it is now a biennial survey. The most current data was gathered between January 2022 and January 2023. This data was gathered while the United States (and world) was still recovering from the effects of the COVID-19 Pandemic, so it will be interesting to see how the 2024 data compares.
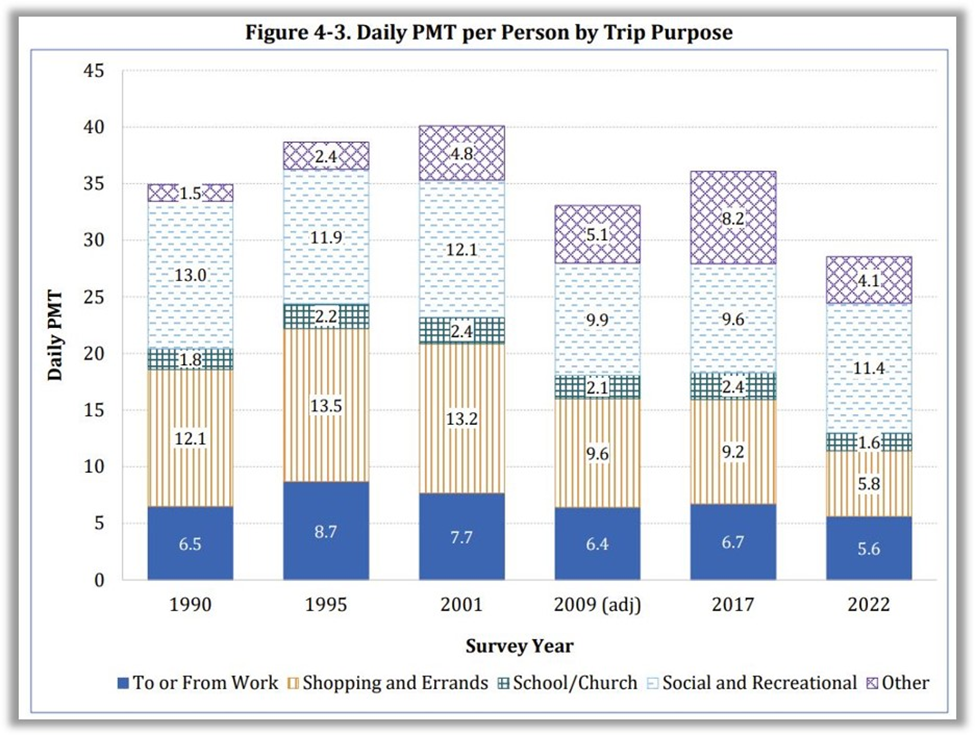
The NHTS links the travel-related information to demographic, geographic, and economic data. It tracks Person Miles of Travel (PMT) by trip purpose, categorized as Shopping and Errands; School/Church; Social and Recreational; and Other.
The website is: https://nhts.ornl.gov/. There is also a 2022 Summary of Travel Trends https://nhts.ornl.gov/assets/2022/pub/2022_NHTS_Summary_Travel_Trends.pdf Report from the US DOT Federal Highway Administration.
Some additional highlights of the 2022 data (charts can be found at https://nhts.ornl.gov/od/):
Passenger Trips by Mode
Vehicle – 86.4%
Active Transportation/Ferries – 12.7%
Rail – 0.7%
Air – 0.2%
Passenger Trips by Purpose
Work – 28.4%
Non-work – 71.6%
Passenger Trips by Distance
0-10 miles – 76%
10-25 miles – 16.5%
25-50 miles – 5%
50-75 miles – 1.1%
75-100 miles – 0.4%
>100 miles – 1.1%
Please note that there are some important caveats about the data related to walking trips. Changes in walk trips throughout the data series could be a result, at least in part, to questionnaire changes in 2009 and 2017, when the NHTS explicitly prompted respondents to include walk and bike trips, including those for exercise, which was not the case in prior surveys. The 2022 NHTS did not explicitly prompt respondents to include walk and bike trips and instead focused on walking or bicycling as a transport mode (not for exercise).
Also, the 2017 and 2022 NHTS changed the definition of a trip to allow walk and bike trips to and from home (loop trips).
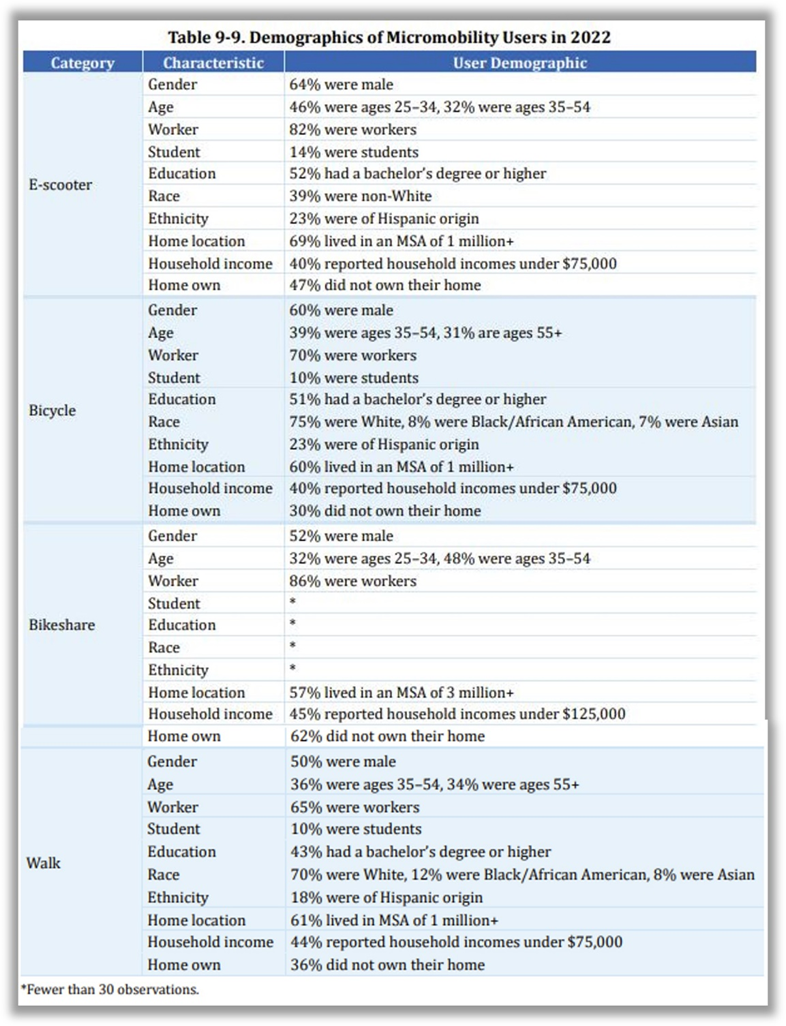
Special Topics in Chapter 9 of the Summary of Travel Trends Report has some fascinating statistics relative to travelers’ age and gender, vehicles per household, and urban versus rural trips. It includes this table about Micromobility Users that you may find as interesting as I did.
We have to understand behavior in order to change it. I hope this resource is as helpful in your work as it has been in mine.
Citation:
Federal Highway Administration. (2022). 2022 NextGen National Household Travel Survey Core
Data, U.S. Department of Transportation, Washington, DC. Available online:
http://nhts.ornl.gov.