STUDENTS DEVELOP NEW VISUAL TRANSIT TOOL DURING COVID-19
Date postedJune 25, 2020
 Eric Burdette and John Larson-Friend are both graduate students at the University of Oregon in the School of Planning, Public Policy, and Management. In April of 2020, both Eric and John applied for project-based scholarships with the Transportation Research Group, a group of professors and students hosted within the university program focused on transportation issues. Their proposals were accepted and quickly tasked with creating a resource for planners and policymakers at the state and local levels on how transit agencies were adapting to the COVID-19 pandemic across the United States.
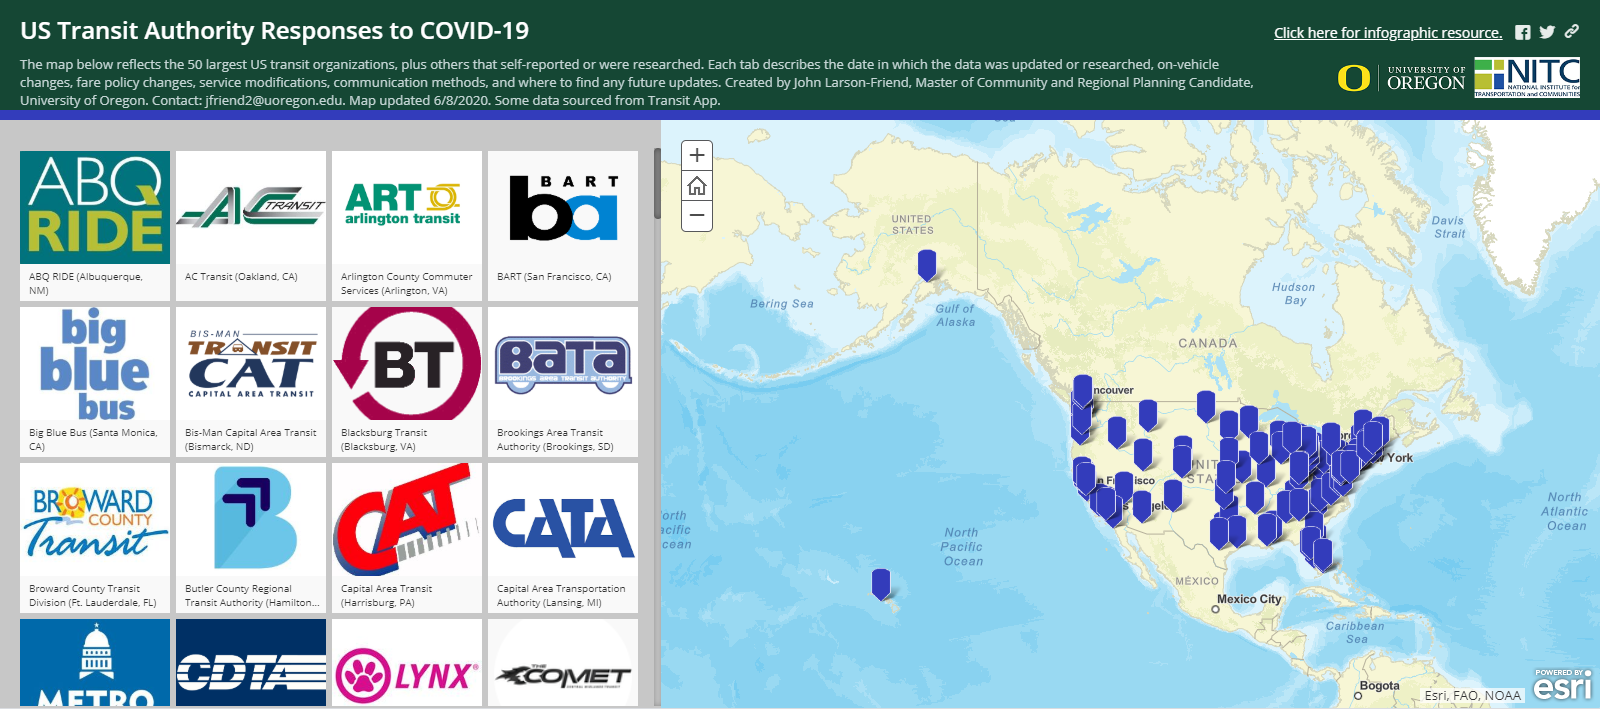
As graduate students, they were both tired of writing memos and wanted to challenge themselves. John chose to create a story map with GIS, and Eric wanted to create an infographic, having never done so before.
John is a member of a Transportation Demand Management (TDM) listserv which he used to send out an initial inquiry seeking information from transit agencies across the country. After receiving many responses from listserv members, John and Eric researched additional transit agencies, focusing on the 50 largest in the nation and including at least one in every state. With a wealth of responses and information, John created a story map that listed 111 specific transit agencies' responses to COVID-19. Meanwhile, Eric analyzed the data for significant and interesting statistics to highlight in an infographic and brief memo.
The results are a unique resource for those in the transportation field who wish to learn how various public agencies in the U.S. have altered their operations and/or services to limit the spread of COVID-19. The story map presents very detailed information on specific transit agencies, while the infographic and memo pull out some intriguing numbers that give a broader picture of how transit agencies adapted to the pandemic.
